3 Core Web Vitals to Improve Your Page Speed and SEO

Knowing how Google measures a web page's technical quality is a business advantage. Search engines use these measurements to rank web pages.
Now that you know how they rank pages, well some of the secret sauce you need to act.
Anytime Google publicly states a metric is a ranking signal you need to pay attention.
The good news is you can calculate hundreds of metrics to improve your technical SEO.
For example, we know page speed is a key metric that cascades to affect other user experience ranking factors.
Page speed is the product of thousands of small pieces. Lately, Google as well as Microsoft, have introduced new tools and metrics to mainstream online marketing.
Today, we’re building on this work and providing an early look at an upcoming Search ranking change that incorporates these page experience metrics. We will introduce a new signal that combines Core Web Vitals with our existing signals for page experience to provide a holistic picture of the quality of a user’s experience on a web page.
Google on Web Vitals and Search Scoring
Having correct HTML semantics, proper spelling, HTTPS and many other 'technical' aspects of SEO are something you can control.Recently Google announced a collection of metrics called web vitals. A set of low level metrics that have tangible impact.
These lower level metrics, related to user experience and page speed and until now have been difficult to measure.
The good news is they will be part of the Lighthouse test, and you can include a library to gather metrics in your pages.
If you log into your Google Search Console (GSC) you will have access to your site's vital scores.
For now there are three primary Web Vitals:
- Largest Contentful Paint - The time it takes for a page’s main content to load. An ideal LCP measurement is 2.5 seconds or faster.
- First Input Delay - The time it takes for a page to become interactive. An ideal measurement is less than 100 milliseconds.
- Cumulative Layout Shift - The amount of unexpected layout shift of visual page content. An ideal measurement is less than 0.1.
Unless you are a page speed nerd like me those terms sound foreign and mean nothing. So I am going to dive into these metrics.
You will learn what they are, why they are important, how to measure and how to improve your website.
- Accessing Web Vitals in Google Search Console
- Largest Contentful Paint
- First Input Delay
- Cumulative Layout Shift
- Key Takeaways
Accessing Web Vitals in Google Search Console
The day Google announced the new web vitals metrics I was alerted to their presence in the Google search console.
In the GSC navigation there is a new entry in the Enhancements section, 'Core Web Vitals'.
When you select this feature a pair of graphs are displayed. They show you the running score for your site over time. One graph represents your mobile scores and the other desktop.
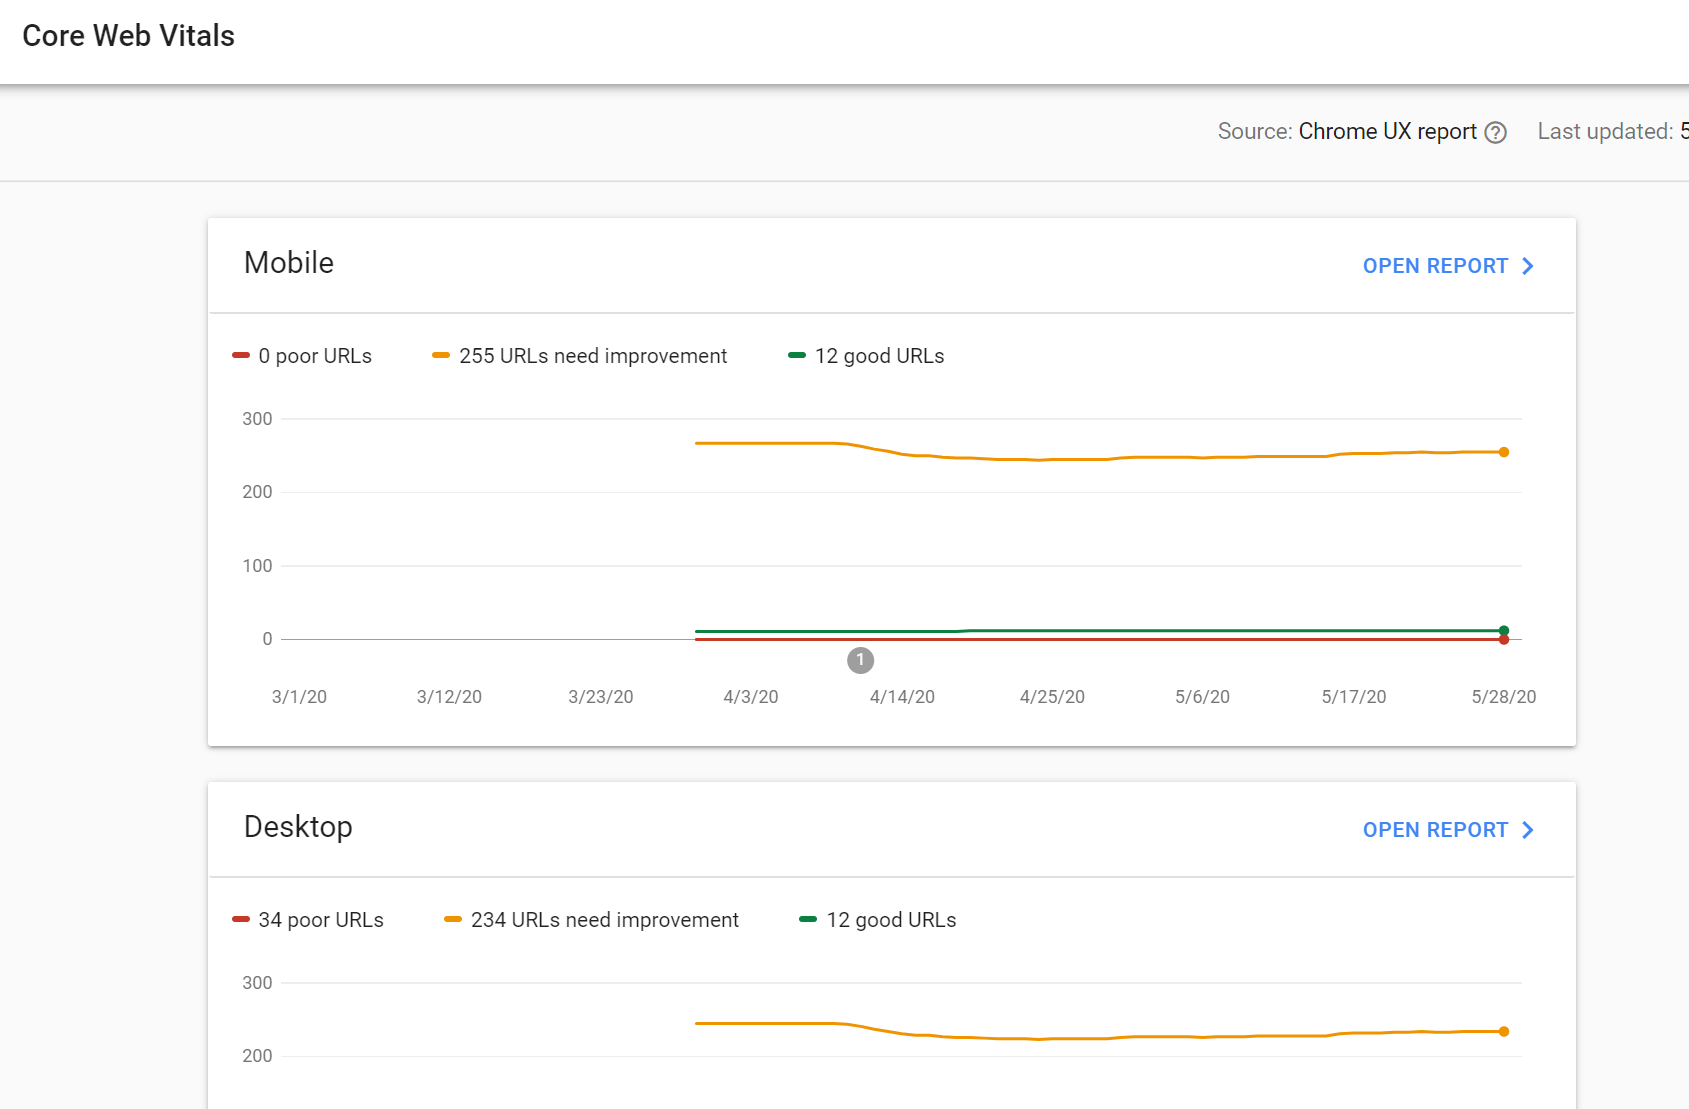
By score I mean how many of your pages are rated good, poor and needing improvement.
As you can see I have a lot of pages that need improvement. How embarrassing!
By selecting the 'Open Report' link in the top right corner of a graph dives deeper into the report.
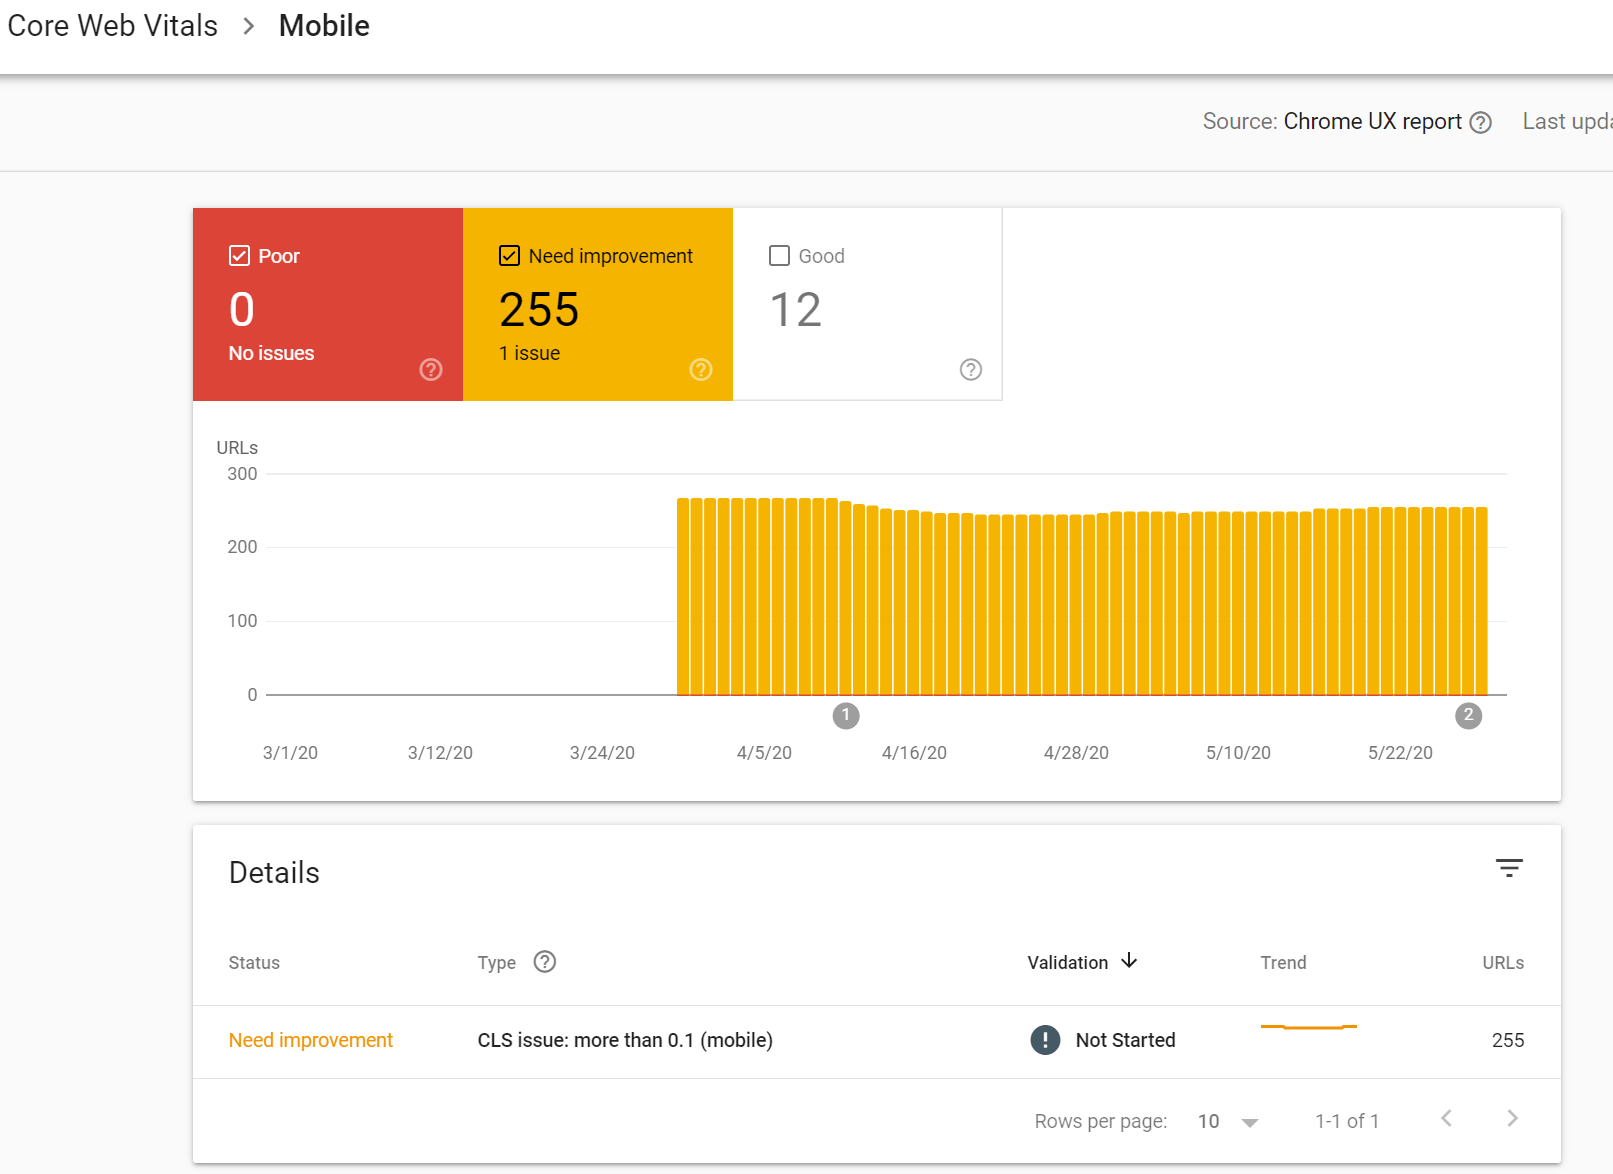
The new graph is a histogram of URL totals over time. You can filter by good, poor and needs improvement.
Below the histogram is another section titled details. In this box you will see a list for different improvements.
Selecting a details row opens yet another, more detailed report. Here you can tell Google you addressed the issue and ask the Googlebot to come back around and test your fixes.
At the bottom of the page you will see a list of example URLs where you have a problem.
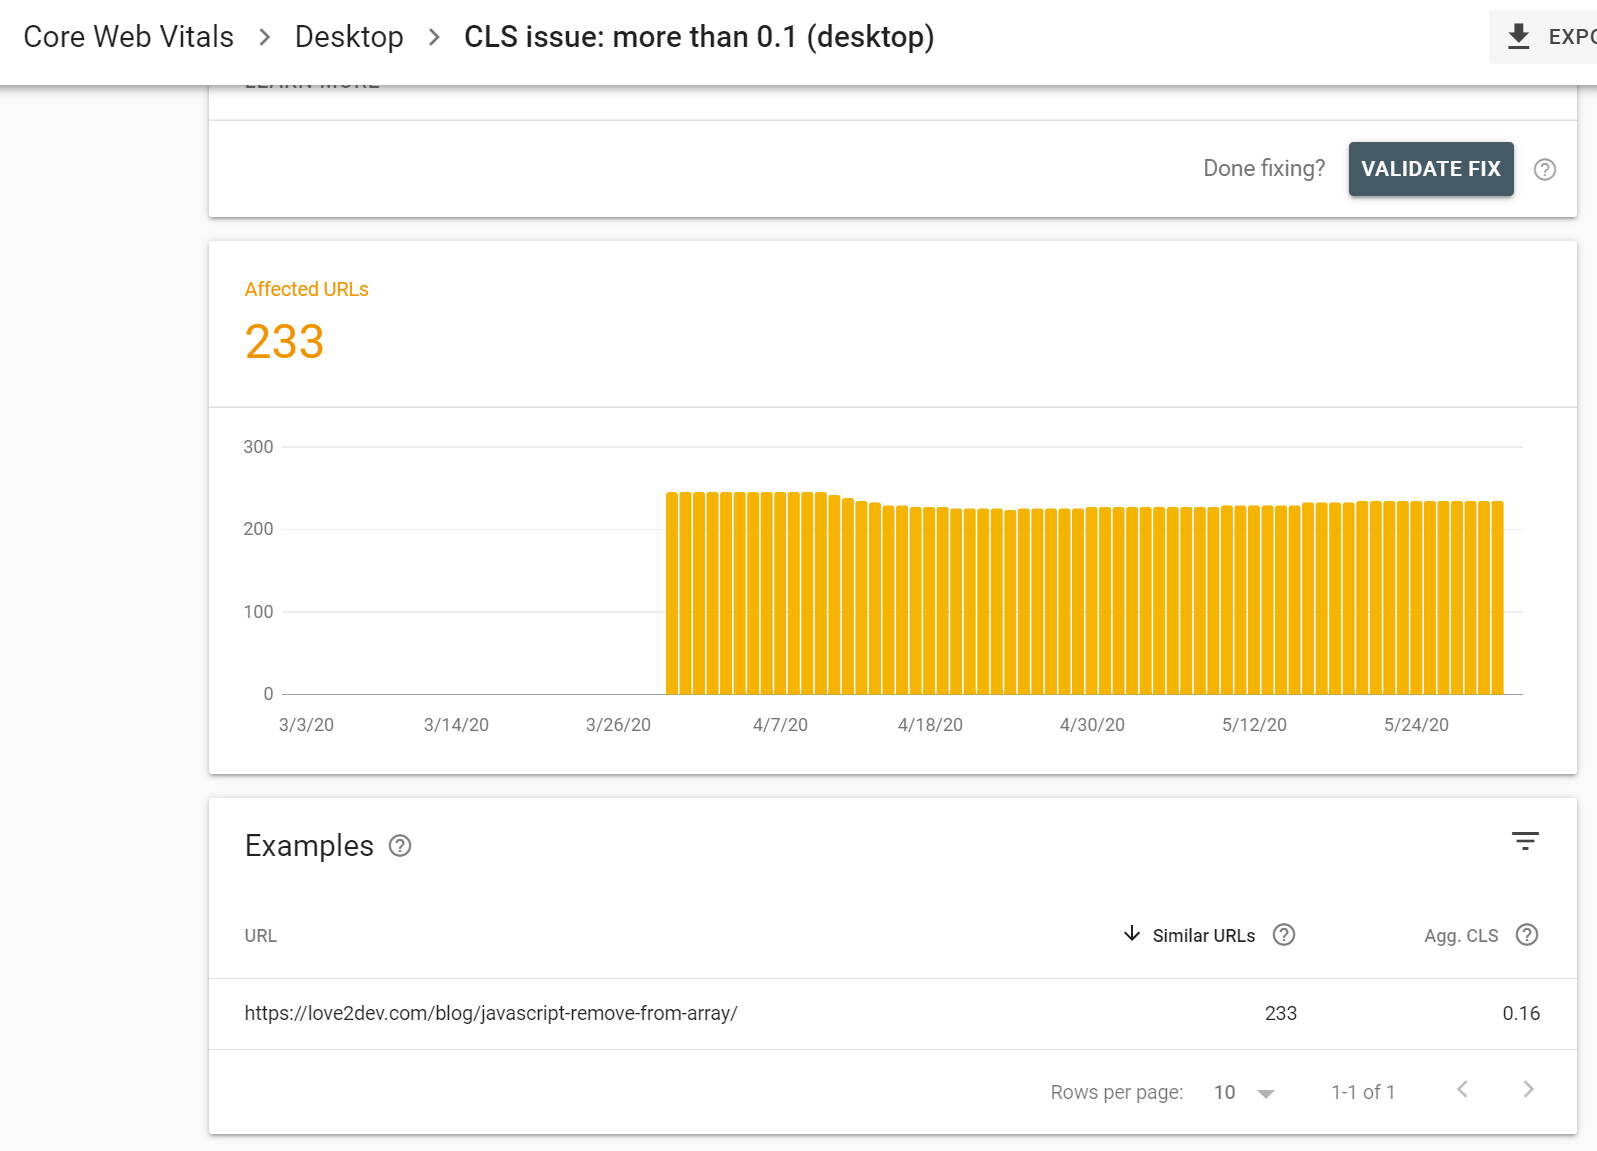
Using this I was able to determine I needed to adjust the way I lazy load my initial article images. More on that later.
Now let's dive into each of the web vital metrics.
Largest Contentful Paint
We have had different metrics to help us understand how a page render. But they don't always tell the story of what is visible on the screen at a given point in time.
Largest Contentful Paint (LCP) is the measure of how long it takes for the largest element in the viewport to render. In other words is the user able to see something meaningful in a reasonable matter of time.
Over mobile you want this metric to be 2.5 seconds or less. This is more time than you think and any web page should be able to meet this guideline.
There is no hard and fast rule for the chosen element. It comes down to what is the largest area other than a simple element. Which sounds a little subjective.
I use the term simple element to refer to a block element, like a DIV with no meaningful direct child content. So if a div is the size of the viewport, but does not have any immediate child elements of content.
For now LCP is a small set of element types:
- img
- image inside an SVG
- the post image of a Video element
- an element with a background image loaded via a url() in CSS
- Block-level elements with inline text elements or just text
The calculated LCP element size is the size rendered in the viewport. If the element extends beyond the viewport it is the clipped size, or what is visible.
How to Measure LCP
Reporting the largest Contentful paint element is a little tricky. Pages render in multiple phases, so the LCP can change as the page renders.
This is why we use the PerformanceEntry API.
This is a newer API, but has broad support. There are lots of nuances you need to negotiate if you want to use the native API.
This is why Google created the web-vitals JavaScript library. You can clone the repository and build the library yourself, or install it as a node package.
Either way you want to use the web-vitals.es5.min.js file in the dist folder. This is a small, 4kb library with a simple API.
The nice thing is it contains additional methods to measure the other web vitals.
How to Fix LCP Issues
Identifying your LCP element and applying optimizations will also cascade to improve your overall rendering.
One of the first improvements you can make is inlining CSS in your document HEAD. The real trick here is to isolate the CSS your page uses.
Most pages load several hundred kilobytes of CSS and 95% of it is not used.

In this example, pulled from an article on this site, the HTML size is 16.8kb. The page relies on Bootstrap CSS, which is 139kb minimized. The page uses a small amount of Bootstrap CSS, hence the small file size even after CSS is inlined.
By inlining the needed CSS you are eliminating an HTTP request as well as making the styles quickly accessible.
Another technique is to pre-render as much markup and content as possible. Avoid using JavaScript to render a page. JavaScript is the slowest path in the rendering cycle. When you use JavaScript you are choosing to delay your page's rendering.
This impacts when not only the LCP element renders, you are delaying everything from rendering.
First Input Delay
Pixel rendering is one thing. Rendered elements give at least the perception of the page usability. First Input Delay (FID) measures how long it takes the page to render and become interactive.
It is the point at which the user can interact, like scrolling the page, setting focus on an input element, etc.
A page does not respond to the user because the UI thread is busy. The UI thread is locked due to excessive JavaScript parsing and execution.
Again, JavaScript is the enemy to your page's performance.
When a browser renders a page it uses a single thread. I call it the UI or user interface thread, you may also see it referred to as the main thread. Because the only user interface thread is blocked the user input is delayed until the current task completes.
Beside reducing the amount of JavaScript and even CSS a page uses you can lazy load many of these assets. If it is not important for the initial page render interactivity then delay loading until after the initial render cycle is complete.
You can also offline heavier processes and data manipulations to a web worker or service worker. They run on a separate thread.
Finally, try to avoid third party or external dependencies. You do not have control over these resources. They can add excess network latencies and often are the source of poorly written code.
How to Measure FID
Just like LCP you can use the web vitals library to measure your FID. From there you can identify delay sources and attack.
import {getLCP} from 'web-vitals';

// Measure and log the current LCP value,
// any time it's ready to be reported.
getLCP(console.log);
Your goal is to reduce this to 100ms. This correlates roughly to how fast our mind perceives a response to a tactile input. An input action would be clicking a link, tapping an input field or opening a dropdown.
The 100ms is the time it takes the brain to expect a visual response to a keystroke, mouse tap or screen touch.
Cumulative Layout Shift
Have you ever visited a web page, just get past the second or third paragraph and suddenly everything jumps?
So frustrating!
Unfortunately this is a common, bad experience propagated around the web. A common source is injected third party content, like ads.
The technical term is Cumulative Layout Shift or CLS.
How to Measure Cumulative Layout Shift
Just like the other metrics the web vitals library to measure your CLS. From there you can identify delay sources and attack.
import {getCLS} from 'web-vitals';

// Measure and log the current CLS value,
// any time it's ready to be reported.
getCLS(console.log);
Your goal is to reduce this to .1 or less. In essence the value should indicate there is no real perceived shift in the page layout as it renders.
How I Fixed CLS Issues
Even I had an issue with this metric. My problem was a product of using lazy image loading.
I use responsive, lazy loaded images in my pages it is difficult to know the dimensions an image will render. Even though I know how wide and tall an image is at different break points does not mean that is the size it will render because viewports vary.
<img src="..." srcset="..." alt="...."/>So when the above the fold image loads there is a jump in the content as the image pushes the copy down the page.
To solve this problem I decided to not lazy load the first image in all my articles. There is no real page speed advantage to delaying the image load. IntersectionObserver triggers the load as soon as the page renders.
Now the jumpiness is avoided.
Key Takeaways
Google and Bing are exposing more of the technical ranking signals. Not just to help online marketers earn better positions, but to make the web better in general.
I always listen to what these giants say because they are much better positioned to collect petabytes of real user data each day. This data is analyzed to determine what real people prefer.
If you are like me, collecting and analyzing that amount of data is not financially viable. When they share actionable items that is exactly what I do. You should too.
One area Love2dev excels is developing and providing technically sound websites.
As an engineer I like to use real data to drive design. If you can control something to make your product better then you should.
Websites are a combination of technical and creative. Technical is something you can control because you own the code.
Creative still requires some nuance, even though there is real data to steer you the right way. It is more mushy than the code and server configuration.
Use core web vital metrics to identify areas for improvement and take action. Over time you will be rewarded with better search rankings and happier customers.


